Tube Race, a daily London navigation game
React, TypeScript, Vite, a Python + TfL Open Data pipeline, Dijkstra, static on S3 and CloudFront.
Tube Race drops you at a London station and asks you to reach a target, but with the map fogged: you can only see the station you are on and the stops one hop away. The rest of the network stays dark until you explore it. A compass tells you which way the target lies and how far, never which line to take. One puzzle a day, the same for everyone, shareable as a spoiler-free grid. It is live at tube-race.isseikuzuki.co.uk.
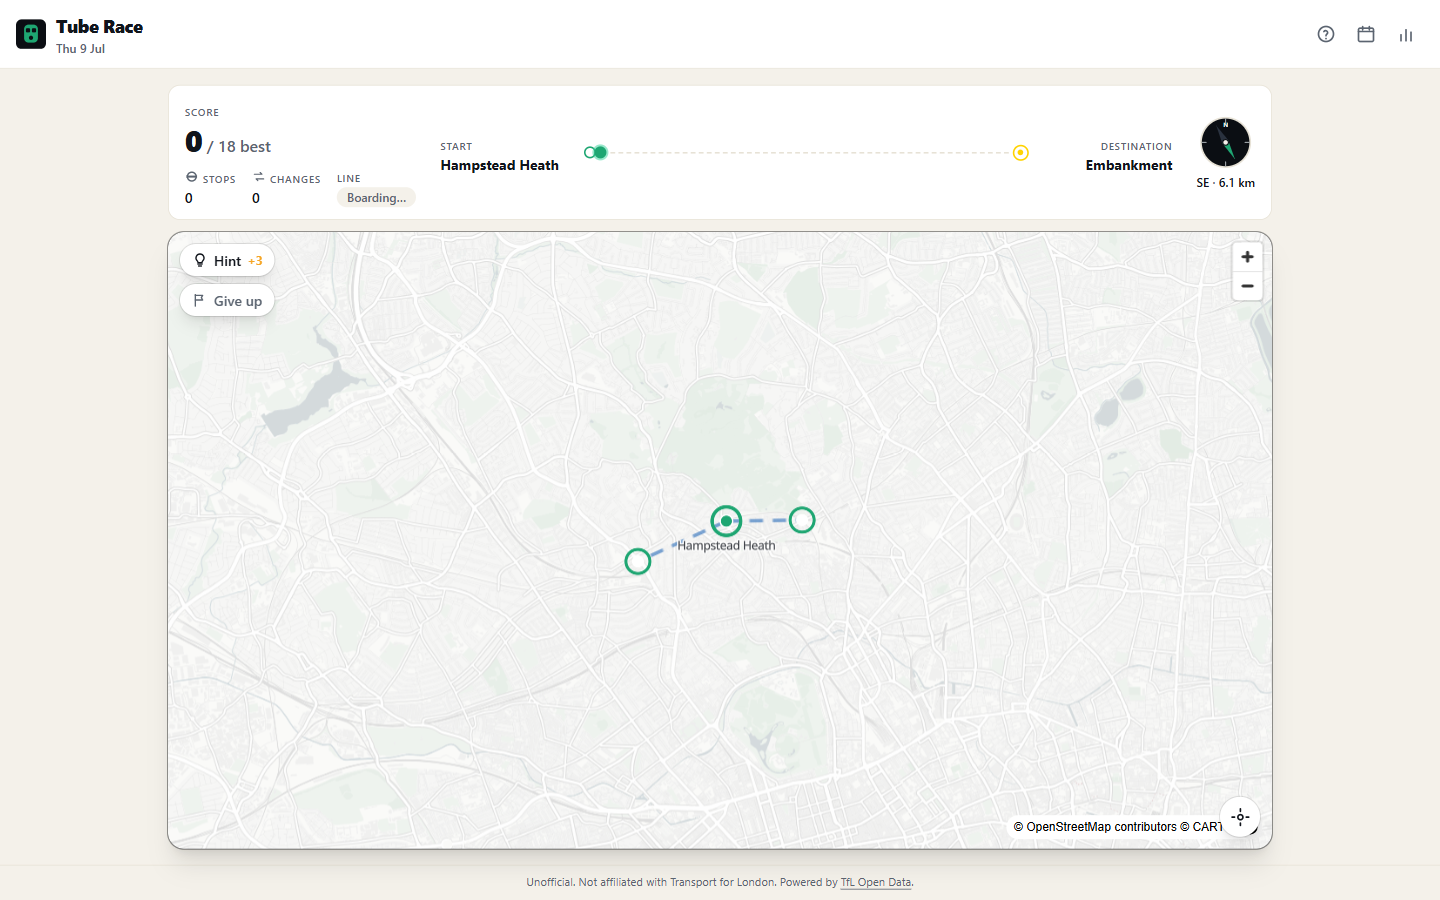
The premise I wanted was narrow: a puzzle in the spirit of Wordle, fun for two minutes once a day, that runs on a real algorithm rather than a word list, costs nothing to operate, and is grounded in something Londoners actually have opinions about. The tube map is a graph, navigating it under fog of war is genuine pathfinding, and everyone who has stood on a platform deciding whether to change at Green Park or push on one more stop already has intuitions the game can reward or punish.
The algorithm underneath
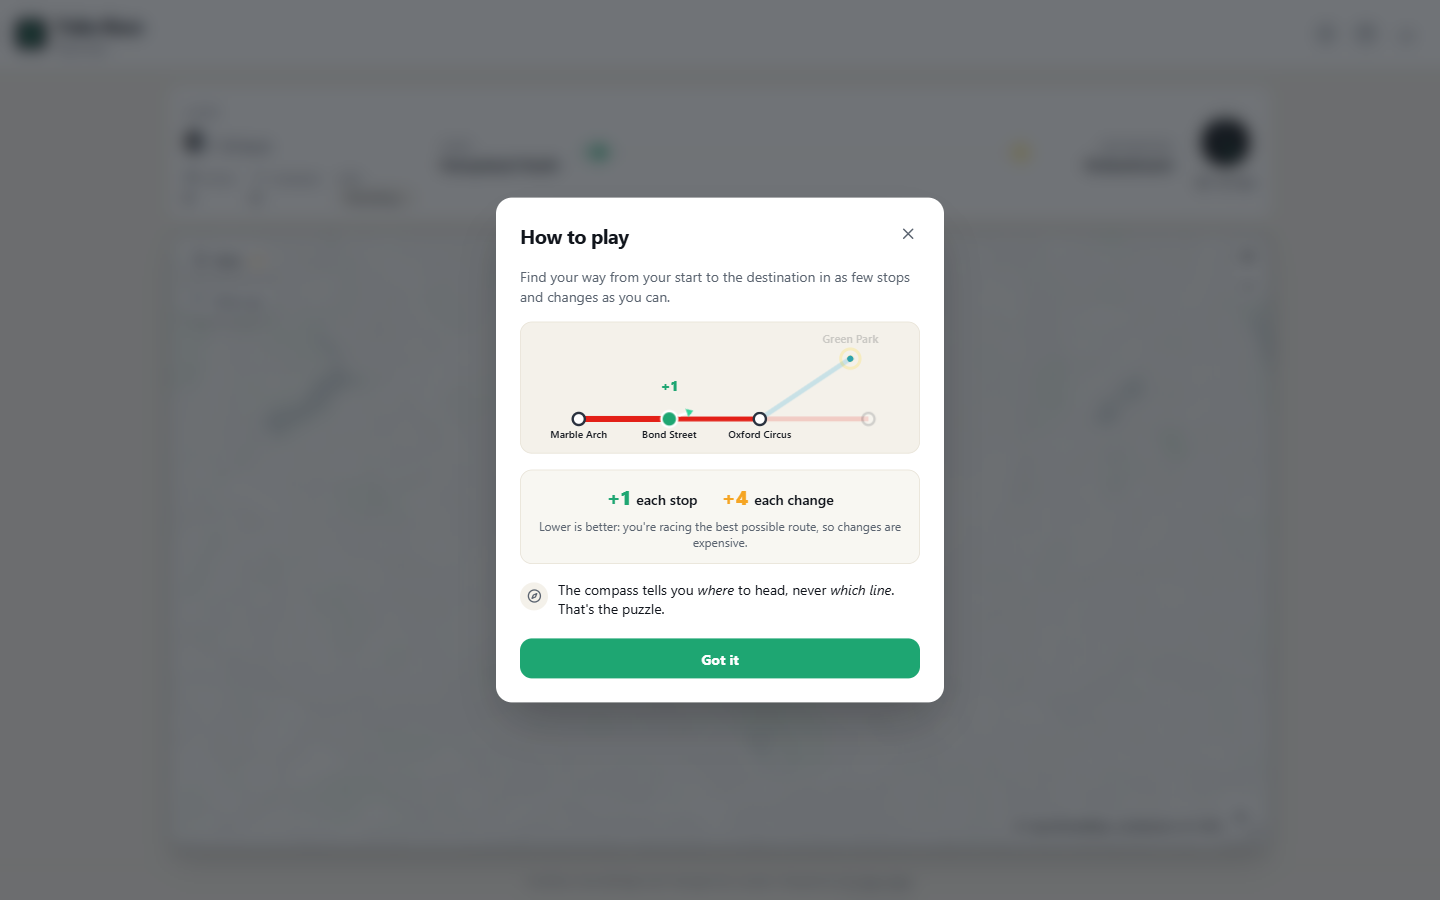
The network is modelled as a weighted graph: stations are nodes, adjacent stops on a line are edges, and a line change carries an extra cost, which is how people actually judge a good tube route. Each stop costs one, each change costs four. When you arrive, Dijkstra computes the genuinely optimal route between the day's start and target, and that is the par you are scored against, "9 stops, 2 changes (best: 7 stops, 1 change)". The whole game runs client-side off a single committed graph.json, so there is no backend, no LLM, and no per-play cost. The daily puzzle is seeded from the date through a small deterministic PRNG, so everyone gets the same start and target, and the engine holds no Date.now() or Math.random() anywhere, which is what makes a shared grid honest.
Measuring how hard a day is
The part I find most interesting is how the game decides whether a given day is easy or hard. A pure shortest-path length does not tell you that, because a route can be long and obvious or short and deceptive. So there is a second solver: a deterministic greedy bot that plays the way the compass tempts you to, always stepping to the station closest to the target, preferring to stay on its current line, refusing to backtrack. The difficulty of a day is the ratio between the greedy bot's cost and the true optimal. When the ratio is near one, following your nose works and the day is easy. When it blows up, the direct-looking moves lead you astray and the day is hard. When the greedy bot never arrives at all, the compass is actively lying to you, and that is a hard day by definition.
I trust the metric because of one moment while calibrating it: the greedy bot, played against an old daily, got trapped oscillating back and forth near Bow Church, unable to make progress because every locally-sensible move pointed it into a dead pocket of the network. That is exactly the shape of day that feels maddening as a human, and the metric had found it on its own. The date seeds both the difficulty tier and the endpoint draw, biased towards recognisable landmark stations so the puzzle reads as London rather than a random pair of depots.
The fun facts
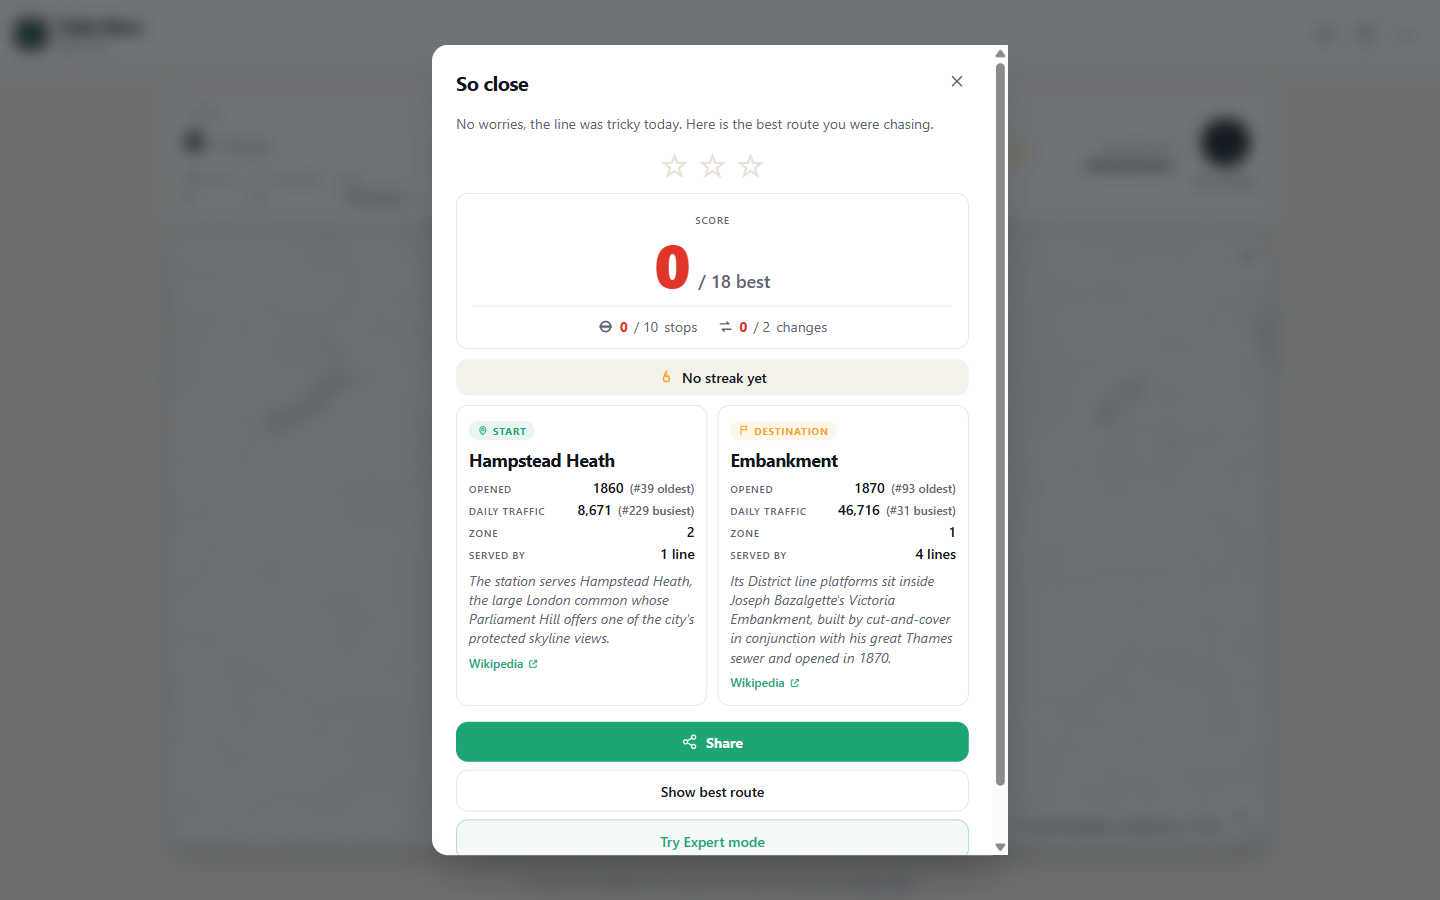
Every station carries a small dossier: the year it opened, its daily traffic, where each ranks against the whole network, and a one-line fact drawn from its history. That data comes from the Python pipeline, which pulls ordered stop sequences for every line from TfL Open Data and builds the graph, then enriches it with opening years and traffic figures, ranked one to four hundred and something across the full population, plus a curated override layer for the gaps and the handful of dates the open data gets wrong.
The fiddly part is identity. TfL returns one stop point per platform, so Victoria on the Victoria line and Victoria on the District line arrive as separate objects and have to be merged into one station node by their parent Naptan code. Get that right and interchanges fall out for free: an interchange is simply any station served by more than one line. Get it wrong and the graph quietly sprouts phantom stations that can never connect.
What I iterated
The build ran as a series of short rounds, each one a batch of focused changes followed by a playtest. Most of the interesting decisions were product calls, not code. The sharpest was killing a mechanic I had specified as core: originally every station you visited stayed revealed, so you slowly built up a map. It played worse than expected, cluttering the board with dead history, so the map became minimal, showing only where you are, where you can go, and where you are heading, and the onboarding was rewritten to stop promising the reveal. Stars replaced a percentage score because a headline of three stars reads instantly and a percentage does not. A hint control lights the optimal next hop for a cost of three, and a give-up path shows you the route you were chasing rather than leaving you stuck. Playtesting on a phone caught real moves landing off the visible map, which is what drove a follow-camera that always frames your current station and every legal move. Puzzles for two years ahead are precomputed and committed, so the archive opens instantly instead of grinding Dijkstra in the browser.
How it's built and hosted
Two clean halves. A Python pipeline (httpx, pydantic v2, ruff and mypy strict) that runs occasionally on my machine and writes graph.json, and a React 19 plus TypeScript game whose engine is pure, DOM-free, and unit-tested to the point where a full run is deterministic and reproducible. The site is a static SPA served from its own S3 bucket and CloudFront distribution, deployed from main by GitHub Actions over OIDC, with no long-lived AWS keys anywhere. No server, no database, no LLM, nothing that costs money per play.